For a detail description of the Boolean overlay approach please refer to Methodology.
Criteria Development:
In order to determine which lands to consider for development, I have identified 3 sets of criteria:
1) Regulations that limit where development can occur
2) Financial considerations important to developers
3) Wildlife
considerations important to environmentalist.
All criteria will be expressed as raster images
I have used two types of criteria for the MCE-Boolean Overlay Method:
i) Constraints- are those boolean criteria that constrain (i.e., limit) my analysis to particular geographic regions. No matter which method is eventually used to aggregate criteria, constraints are always boolean images. In this case, the constraints differentiate areas that I can consider suitable for urban development from those that cannot be considered suitable under any conditions in the North Shore region.
ii) Factors- are those that define some degree of suitability for all geographic regions. They define areas or alternatives in terms of a continuous measure of suitability. Individual factor scores may either enhance (with high values) or detract from (with low values) the overall suitability of an alternative. The degree to which this happens depends upon the individual criteria and the from of aggregation eventually used.
The Boolean Overlay approach consists of two constraints and five factors in which have been developed by me.
Constraint 1 - Water areas
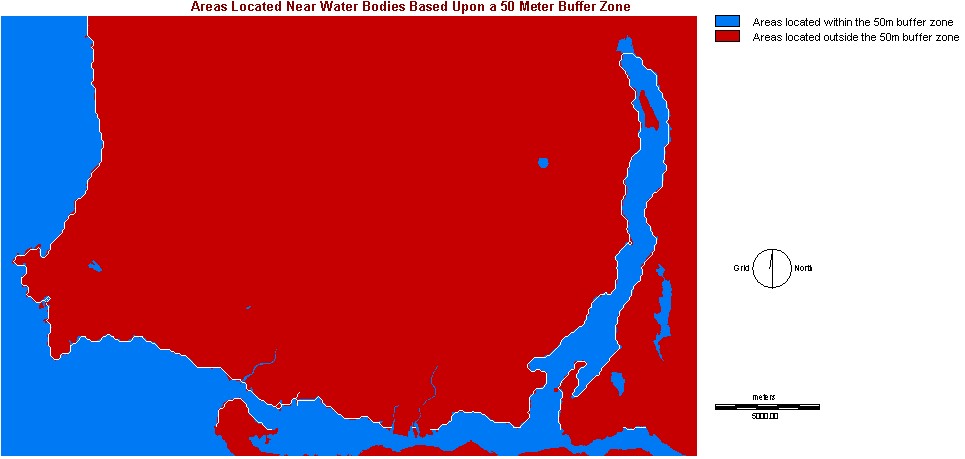
I have suggested that building regulations are constraints that limit the areas available for development. I have assumed that new development cannot occur within 50 meters of open water bodies (including lakes).
This involves the production of a raster image called WATERCON.rst. The image was created by reclassing areas from water to areas of land then placing a 50 meter buffer zone around all areas that contained water (lakes and open water in this case) using LANDUSE.rst as the image file. According to the image below, areas indicated in red show areas to be considered for urban development based upon a 50 meter buffer zone placed around water bodies, those indicated in blue are not to be considered at all.
Image shown below is WATERCON.rst:
Constraint 2 - Landuse
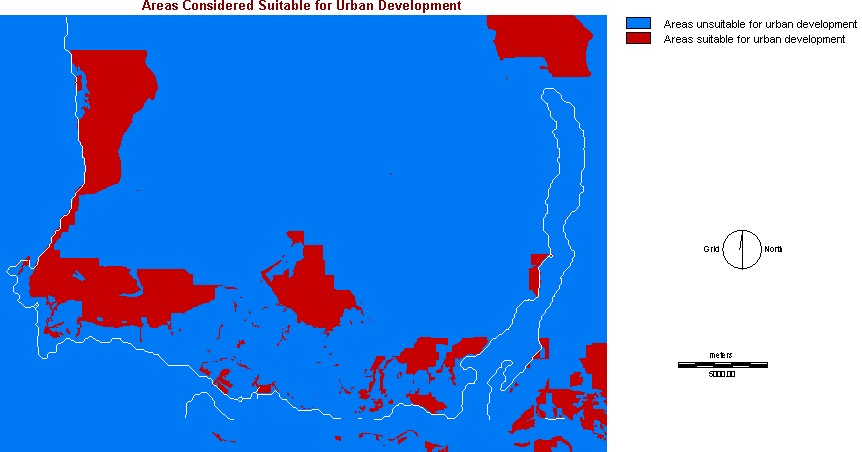
In addition to the suggested legal constraints above, new land for urban development will be constraint by current landuse -- new development cannot occur on already developed land.
This involves the production of a raster image called LANDCON.rst. The image was created by reclassing areas from open undeveloped land to areas of developed and protected land (including all water bodies) using LANDUSE.rst as the image file. According to the image below, areas indicated in red show areas to be considered for urban development based upon "open, undeveloped land", those indicated in blue are not to be considered at all.
Image shown below is LANDCON.rst:
Factor 1 - Distance from water sources (this includes lakes and open water bodies)
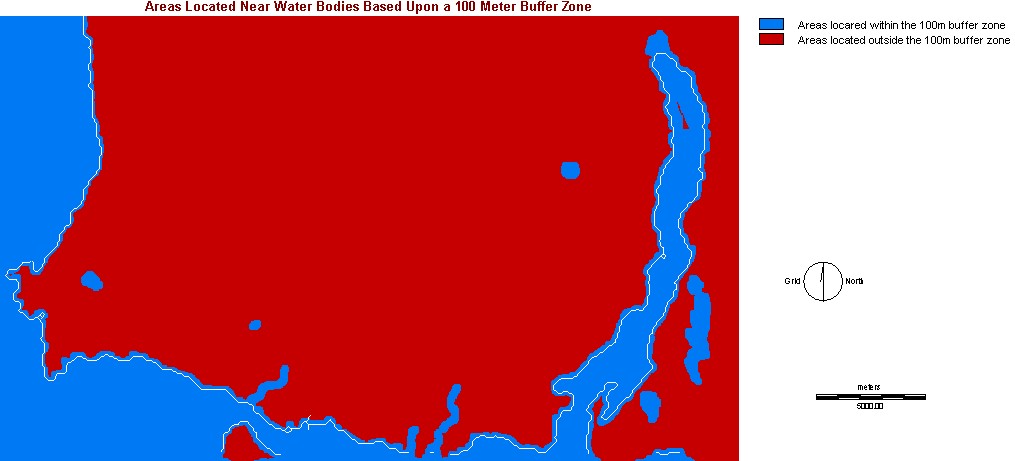
Because local groundwater is at risk from septic system pollution and runoff, I have pointed out that areas further from water bodies and wetlands are more suitable than those are nearby. Although these areas are already protected by a 50 meter buffer, I want to see this extended by an additional 50 meters. In this case, suitable areas will have to be at least 100 meters from any water body source.
This involves the production of a raster image called WATERBOOL2.rst. The image was created by placing a 100m buffer using WATERDIST.rst as the image source. According to the image below, those indicated in red show areas to be considered for urban development based upon a 100 meter buffer zone placed around water sources, those indicated in blue are not to be considered at all.
Image shown below is WATERBOOL2.rst:
Factor 2 - Distance from watersheds
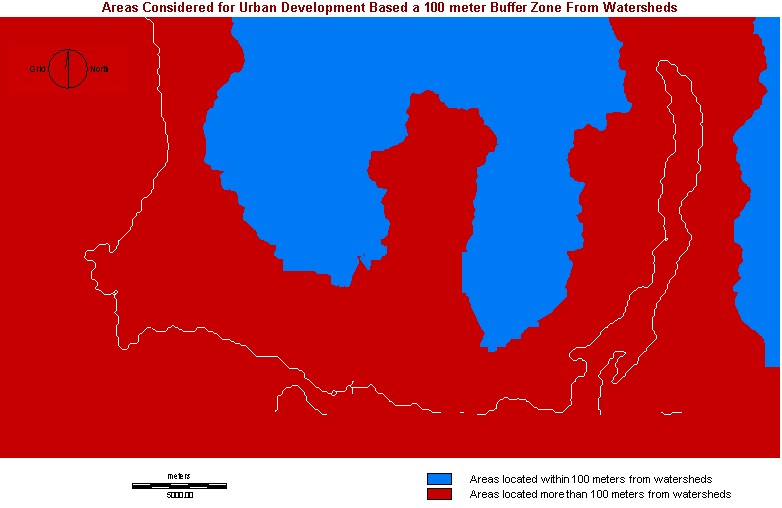
The watersheds that are located in the North Shore stores almost all the water that is used in the Greater Vancouver Regional District. With this in mind, a 100 meter buffer should be in place ot protect the quality and the existence of the fresh water they contain.
This involves the production of a raster image called WATERSHEDBOOL2.rst. The image was created by placing a 100m buffer using WATERSHEDDIST.rst as the image source. According to the image below, areas indicated in red show those to be considered for urban development based upon a 100 meter buffer zone placed around the watersheds, those indicated in blue are not to be considered at all.
Image shown below is WATERSHEDBOOL2.rst:
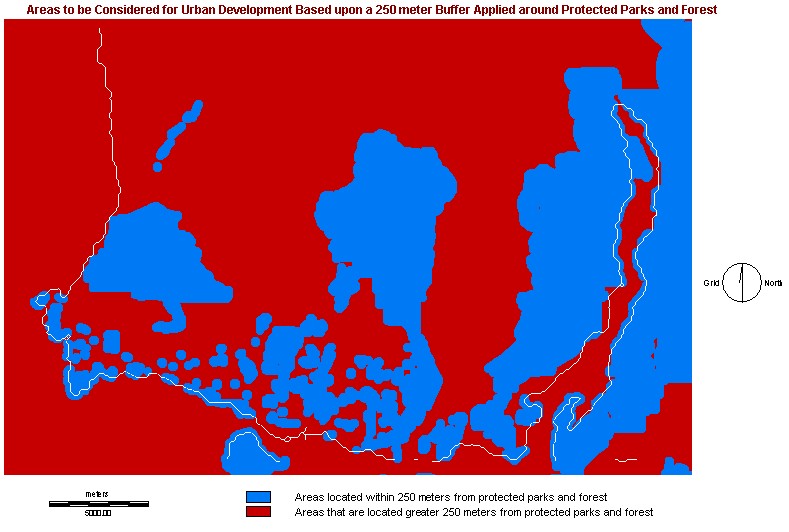
Factor 3 - Distance from Protected Parks and Forests
To ensure the safety of the people living in the North Shore area, no development should occur within a certain distance due to the occurrence of forest fires which can potential cause damage applied to the people or to the property. In return, the 250 meter buffer also provides protection to the forests/parks if a fire was to occur on developed land.
This involves the production of a raster image called FOREST_PARKBOOL2.rst. The image was created by placing a 250m buffer using FOREST_PARKDIST.rst as the image source. According to the image below, areas indicated in red show areas to be considered for urban development based upon a 250 meter buffer zone placed around the protected parks/forests, those indicated in blue are not to be considered at all.
Image shown below is FOREST_PARKBOOL2.rst:
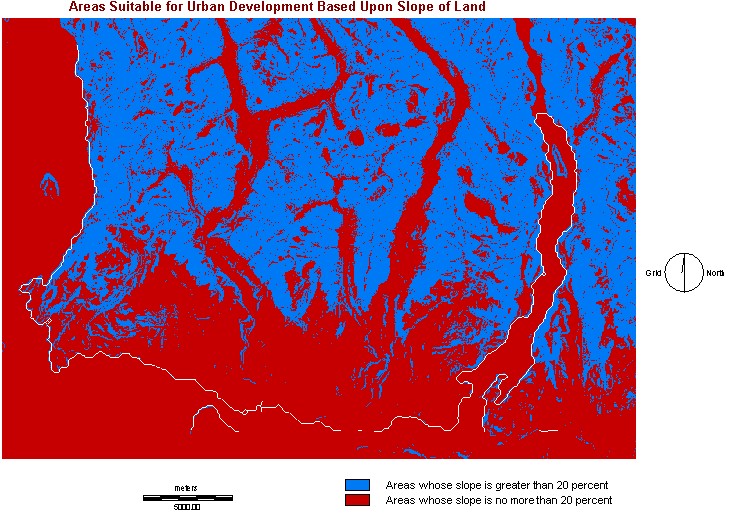
Factor 4 - Slope
The slope of the land effects the soil's ability to support the foundation of building structures measured by the soil erodibility factor (Brady and Weil 2000). Lands that display higher degrees of slopes will be subjected to greater severity's of soil erosion (Brady and Weil 2000).
Because relative slopes make housing and road construction less expensive, I have reclassified the slope image so that those areas with a slope no more than 20% will be considered suitable and those greater than 20% will be considered unsuitable.
This involves the production of a raster image called SLOPEBOOL.rst. The image was created by a reclass (1 = 0 to < 21, 0 = 21 to 9999), using SLOPE.rst as the image source. According to the image below, areas indicated in red show areas to be considered for urban development in which its topography is not more than 20%, those indicated in blue are not to be considered at all (because the topography is more than 20%).
Image shown below is SLOPEBOOL.rst:
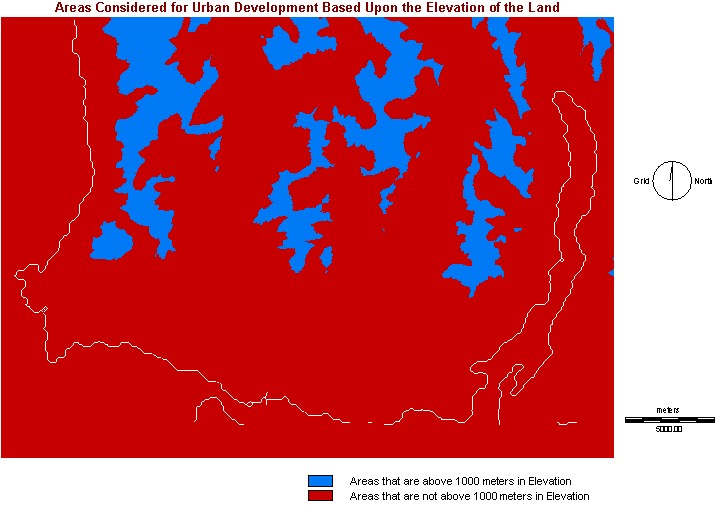
Factor 5 - Elevation
Elevation is a developmental factor in the North Shore region because atmospheric temperature does decrease will increasing elevation (Lutgens and Tarbuck, 1992). Areas where the average air temperature below zero degrees Celsius can expect permafrost to occur. Permafrost effects the foundation of buildings in terms of stability. Land subjected to permafrost will display free thaw cycles throughout the year and will display over saturated conditions (ex muddiness) that are not ideal for developmental purposes (Strahler and Strahler, 1997) . Since Vancouver has an average annual air temperature of 10.0 degrees Celsius (Farley, 1979); and since air temperature decreases about 10 degrees Celsius for every 1000 meters (Ahrens, 1998), areas above 1000 meters will be not considered suitable for urban development (and vice versa).
This involves the production of a raster image called ELEVATION.rst. The image was created by a reclass (1 = 0 to < 1001, 0 = 1001 to 9999), using DEM_VAN.rst as the image source. According to the image below, areas indicated in red show areas to be considered for urban development in which the topography is not more than 1000 meters in elevation, those indicated in blue are not to be considered at all (because the topography is more than 1000 meters in elevation).
Image shown below is ELEVATION.rst:
Please click here
for results of the Boolean Approach (4.1b)
Or click here to go back to main menu